1) Percentage of youngest children age 0-5 months who were fed exclusively with breastmilk during the previous day or night.
2) Percentage of youngest children age 0-5 months who were fed both breastmilk and formula and/or animal milk during the previous day or night.
Coverage:
Population base: Living children living with their mother born 0-5 months before the survey (KR file)
Time period: Previous day or night before the survey
Numerators:
1) Number of youngest children age 0-5 months living with their mother who received only breastmilk during the previous day or night preceding the interview (b19 < 6 & b9 = 0 & m4 = 95 & received only breastmilk - see Numerator 2 for Percent distribution of children who were fed breastmilk only.
2) Number of youngest children age 0-5 months living with their mother who were fed both breastmilk and formula and/or animal milk during the previous day or night preceding the interview (b19 < 6 & b9 = 0 & m4 = 95 & (v411 = 1 or v411A = 1))
Denominator: Number of youngest children age 0-5 months living with their mother (b9 = 0 & b19 < 6)
See Calculation below for the selection for the denominator and select for the appropriate age group.
Variables: KR file.
|
caseid |
Case Identification |
|
b5 |
Child is alive |
|
b9 |
Child lives with whom |
|
b19 |
Current age of child in months |
|
m4 |
Duration of breastfeeding |
|
m39a |
Did eat any solid, semi-solid or soft foods yesterday |
|
v409 |
Gave child plain water |
|
v409a |
Gave child sugar water |
|
v410 |
Gave child juice |
|
v410a |
Gave child tea or coffee |
|
v411 |
Gave child tinned, powdered or fresh milk |
|
v411a |
Gave child baby formula |
|
v412 |
Gave child fresh milk |
|
v412a |
Gave child fortified baby food (cerelac, etc) |
|
v412b |
Gave child other porridge/gruel |
|
v412c |
Gave child soup/clear broth |
|
v413 |
Gave child other liquid |
|
v413a |
Gave child yogurt as a drink |
|
v413b |
Gave child soy milk |
|
v413c |
Gave child chocolate flavored drink |
|
v413d |
Gave child sodas/malt/sports/energy drinks |
|
v413e-i |
Gave child CS liquid |
|
v414a |
Gave child any other vegetables |
|
v414b |
Gave child sausages, hot dogs, frankfurters, ham, bacon, salami, canned food |
|
v414c |
Gave child nuts, seeds |
|
v414d |
Gave child any insects |
|
v414e |
Gave child bread, noodles, other made from grains |
|
v414f |
Gave child potatoes, cassava, or other tubers |
|
v414g |
Gave child eggs |
|
v414h |
Gave child meat (beef, pork, lamb, chicken, etc) |
|
v414i |
Gave child pumpkin, carrots, squash (yellow or orange inside) |
|
v414j |
Gave child any dark green leafy vegetables |
|
v414k |
Gave child mangoes, papayas, other vitamin A fruits |
|
v414l |
Gave child any other fruits |
|
v414m |
Gave child liver, heart, other organs |
|
v414n |
Gave child fish or shellfish |
|
v414o |
Gave child food made from beans, peas, lentils, nuts |
|
v414p |
Gave child cheese, yogurt, other milk products |
|
v414q |
Gave child oil, fats, butter, products made of them |
|
v414r |
Gave child chocolates, sweets, candies, pastries, etc |
|
v414s |
Gave child other solid, semi-solid food |
|
v414t |
Gave child CS foods |
|
v414u |
Gave child CS foods |
|
v414v |
Gave child yogurt |
|
v414w |
Gave child common sentinel sweet food |
|
v414wa |
Gave child CS foods |
|
v414wb |
Gave child CS foods |
|
v414wc |
Gave child CS foods |
|
v414wd |
Gave child CS foods |
|
v414we |
Gave child CS foods |
|
v005 |
Woman’s individual sample weight |
Numerator divided by denominator, multiplied by 100.
Denominator:
To select the cases for the denominator, first filter or keep only living children living with the mother born in the preceding 6 months (keep/select if b19 < 6 & b9 = 0), then keep only the youngest child (keep/select if the first entry in the dataset (_n = 1) or the first for this respondent (caseid ≠ caseid[_n-1]) as the youngest child is the first listed for the respondent in the data file). The commands in Stata and SPSS are given below:
Stata |
|
* keep if under 6 months and living with mother keep if b19 < 6 & b9 == 0 * and keep the last born of those. * if caseid is the same as the prior case, then not the last born keep if _n == 1 | caseid != caseid[_n-1] |
SPSS |
|
* keep if under 6 months and living with mother. Select if (b19 < 6 & b9 = 0). * and keep the last born of those. * if caseid is the same as the prior case, then not the last born. Select if (caseid <> lag(caseid)). |
Missing data on breastfeeding is treated as not currently breastfeeding in numerator and included in the denominator. Missing and “don’t know” data on foodsand liquids given is treated as not given in numerator and included in denominator.
The indicator calculation for the percentage of children receiving mixed milk feeding excludes yogurt drinks and soy milk and nut milks, whereas yogurt drinks is included in the feeding practice by age indicator when calculating the percent distribution of children consuming breastmilk and formula and/or animal milk.
The indicator on mixed breast and non-breast milk feeding has been renamed to mixed milk feeding.
See Changes over Time for Percent distribution of children who were fed breastmilk only
WHO and UNICEF 2021. Indicators for assessing infant and young child feeding practices: definitions and measurement methods. https://www.who.int/publications/i/item/9789240018389
WHO. 2017. Global Nutrition Monitoring Framework: Operational Guidance for Tracking Progress in Meeting Targets for 2025. http://www.who.int/nutrition/publications/operational-guidance-GNMF-indicators/en/
Xiaodong C., T. Wardlaw and D.W Brown. 2012. “Global trends in exclusive breastfeeding.” International Breastfeeding Journal 7:12 DOI: https://doi.org/10.1186/1746-4358-7-12
https://internationalbreastfeedingjournal.biomedcentral.com/articles/10.1186/1746-4358-7-12
DHS-8 Tabulation plan: Tables 11.4 and 11.10
API Indicator IDs:
CN_BRFS_C_EXB, CN_BRFS_C_CMP
WHO/UNICEF IYCF Indicator 4: Exclusive breastfeeding under 6 months
WHO/UNICEF IYCF Indicator 5: Mixed milk feeding under 6 months
WHO 100 Core Health Indicators: Exclusive breastfeeding 0-5 months of age
MICS6 Indicator TC.32: Exclusive breastfeeding under 6 months
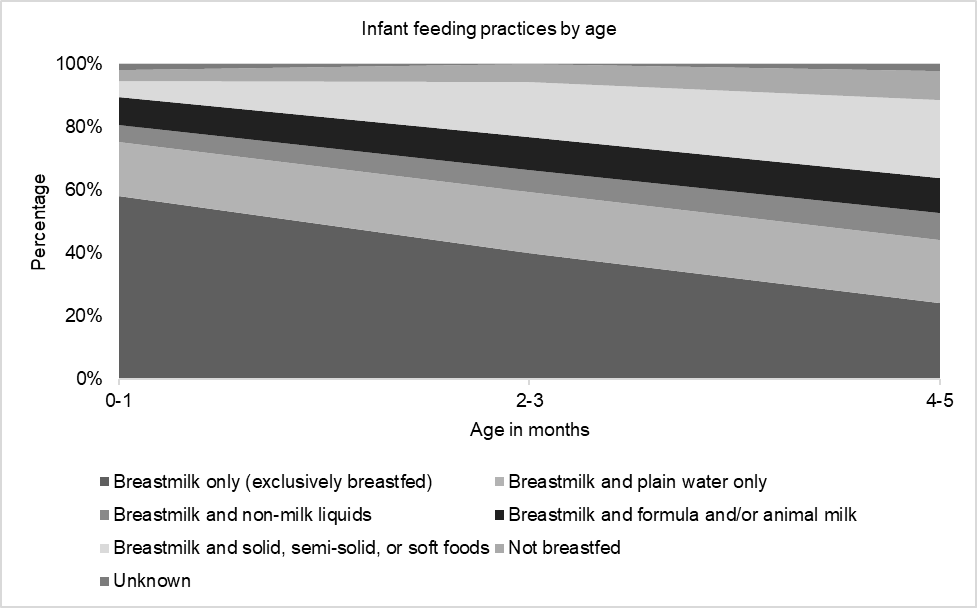
Percent distribution of youngest children 0-5 months who are living with their mother who are:
1) Exclusively breastfeeding.
2) Breastfeeding and consuming plain water only.
3) Breastfeeding and consuming non-milk liquids.
4) Breastfeeding and consuming formula and/or animal milk.
5) Breastfeeding and consuming solid, semi-solid, or soft foods.
6) Not breastfeeding.
7) Unknown.
Coverage:
Population base: Living children living with their mother born 0 to 5 months before the survey (KR file)
Time period: Previous day or night before the survey
Numerators:
Number of youngest children age 0-5 months who are living with their mother (see Calculation below) who were:
Breastfeeding (m4 = 95):
1) and given nothing else the previous day or night preceding the interview (exclusive breastfeeding) (not in numerators 2-5)
2) and given plain water only the previous day or night preceding the interview (v409 = 1 & not in numerators 3-5).
3) and given non-milk liquids the previous day or night preceding the interview ((v409a = 1 or v410 = 1 or v410a = 1 or v412c = 1 or v413 = 1 or any of v413a – d = 1) & not in numerators 4 or 5).
4) and given formula and/or animal milk the previous day or night preceding the interview ((v411 = 1 or v411a = 1) & not in numerator 5).
5) and given solid or semi-solid foods the previous day or night preceding the interview. (v412a = 1 or v412b = 1 or any of v414a – w = 1)
6) Not breastfeeding (m4 ≠ 95), or
7) Unknown (v409 = 8 or v409a = 8 or v410 = 8 or v410a = 8 or v412c = 8 or v413 = 8 or any of v413a – d = 8 or any of v414a – w = 8)
Denominator: Number of youngest children born 6 months preceding the survey who are living with their mother (see Calculation below)
Variables: KR file.
|
caseid |
Case Identification |
|
b5 |
Child is alive |
|
b9 |
Child lives with whom |
|
b19 |
Current age of child in months |
|
m4 |
Duration of breastfeeding |
|
m39a |
Did eat any solid, semi-solid or soft foods yesterday |
|
v409 |
Gave child plain water |
|
v409a |
Gave child sugar water |
|
v410 |
Gave child juice |
|
v410a |
Gave child tea or coffee |
|
v411 |
Gave child tinned, powdered or fresh milk |
|
v411a |
Gave child baby formula |
|
v412 |
Gave child fresh milk |
|
v412a |
Gave child fortified baby food (cerelac, etc) |
|
v412b |
Gave child other porridge/gruel |
|
v412c |
Gave child soup/clear broth |
|
v413 |
Gave child other liquid |
|
v413a |
Gave child yogurt as a drink |
|
v413b |
Gave child soy milk |
|
v413c |
Gave child chocolate flavored drink |
|
v413d |
Gave child sodas/malt/sports/energy drinks |
|
v413e-i |
Gave child CS liquid |
|
v414a |
Gave child any other vegetables |
|
v414b |
Gave child sausages, hot dogs, frankfurters, ham, bacon, salami, canned food |
|
v414c |
Gave child nuts, seeds |
|
v414d |
Gave child any insects |
|
v414e |
Gave child bread, noodles, other made from grains |
|
v414f |
Gave child potatoes, cassava, or other tubers |
|
v414g |
Gave child eggs |
|
v414h |
Gave child meat (beef, pork, lamb, chicken, etc) |
|
v414i |
Gave child pumpkin, carrots, squash (yellow or orange inside) |
|
v414j |
Gave child any dark green leafy vegetables |
|
v414k |
Gave child mangoes, papayas, other vitamin A fruits |
|
v414l |
Gave child any other fruits |
|
v414m |
Gave child liver, heart, other organs |
|
v414n |
Gave child fish or shellfish |
|
v414o |
Gave child food made from beans, peas, lentils, nuts |
|
v414p |
Gave child cheese, yogurt, other milk products |
|
v414q |
Gave child oil, fats, butter, products made of them |
|
v414r |
Gave child chocolates, sweets, candies, pastries, etc |
|
v414s |
Gave child other solid, semi-solid food |
|
v414t |
Gave child CS foods |
|
v414u |
Gave child CS foods |
|
v414v |
Gave child yogurt |
|
v414w |
Gave child common sentinel sweet food |
|
v414wa |
Gave child CS foods |
|
v414wb |
Gave child CS foods |
|
v414wc |
Gave child CS foods |
|
v414wd |
Gave child CS foods |
|
v414we |
Gave child CS foods |
|
v005 |
Woman’s individual sample weight |
Numerator divided by denominator, multiplied by 100.
Denominator:
To select the cases for the denominator, first filter or keep only living children living with the mother born in the preceding 6 months (keep/select if b19 < 6 & b9 = 0), then keep only the youngest child (keep/select if the first entry in the dataset (_n = 1) or the first for this respondent (caseid ≠ caseid[_n-1]) as the youngest child is the first listed for the respondent in the data file). The commands in Stata and SPSS are given below:
Stata |
|
* keep if under 6 months and living with mother keep if b19 < 6 & b9 == 0 * and keep the last born of those. * if caseid is the same as the prior case, then not the last born keep if _n == 1 | caseid != caseid[_n-1] |
SPSS |
|
* keep if under 6 months and living with mother. Select if (b19 < 6 & b9 = 0). * and keep the last born of those. * if caseid is the same as the prior case, then not the last born. Select if (caseid <> lag(caseid)). |
Missing data on breastfeeding is treated as not currently breastfeeding in numerator and included in the denominator. Missing and “don’t know” data on foods and liquids given is treated as not given in numerators 1-5 and included in denominator, and included in the numerator and denominator for indicator 7 (Unknown).
Data are also presented in an area graph to visualize IYCF practice progression during the first 6 months such as below:
The infant feeding area graph is for children age 0-6 months. Data are typically disaggregated by age groups of 2 months.
If the last-born child is deceased or not living with the mother, questions on foods and liquids are asked of the prior child born in the two years preceding the interview who is living with the mother. However, in surveys prior to DHS-8 the question on breastfeeding was not asked of this child. In this situation the child will be treated as not currently breastfeeding in the numerator and included in the denominator. This was relevant when the indicators were presented for children up to age 2 years but is no longer relevant for children age 0-5 months.
Surveys based on the DHS-8, DHS-7, and DHS-VI questionnaire only ask about the feeding status of the youngest living child who lives with the mother and was born in the preceding two years; DHS-V ask about the feeding status of the youngest living child who lives with the mother and was born in the preceding three years; and DHS-IV surveys ask about the feeding status of all children under age 3. When comparing the results of DHS-8 surveys to earlier surveys, it should be noted that in DHS-8 the indicators on feeding practices by age are restricted to the youngest children 0-5 months, DHS-VI and DHS-7 the indicators are restricted to the youngest children under age 2 living with their mothers; DHS-V surveys are restricted to the youngest children under age 3 living with their mothers; and DHS-IV surveys all children under age 3.
Wording of questions in DHS-8 differ from those in the DHS-7 or DHS-VI surveys, and DHS-V and DHS-IV, and questions about foods made with oil, fat, or butter were not asked.
The list of foods asked about has changed from round to round of DHS, and food lists can vary by survey. Users should check the questionnaires used when comparing results from different surveys.
Additionally, in DHS-IV surveys, respondents were asked how many times yesterday/last night the child received the specific food.
An alternative formulation of exclusive breastfeeding would be to consider only children who have never received anything but breastmilk. The required information was collected only in DHS-II, when respondents were asked about the age of introduction of liquids and foods. These questions were dropped when they were found to produce older ages at introduction of foods than that estimated from current status.
The wording of the indicator for the percentage of children consuming other milk has been changed in the DHS-8 tabulation plan. It is now worded as the percentage of children consuming formula and/or animal milk.
In prior rounds of DHS, the creation of the indicator breastfeeding and given solid or semi-solid foods the previous day or night also included the use of m39a (Did eat any solid, semi-solid or soft foods yesterday). The variable m39a was dropped from the calculation in DHS-8, following the WHO guidance for this indicator.
WHO and UNICEF 2021. Indicators for assessing infant and young child feeding practices: definitions and measurement methods. https://www.who.int/publications/i/item/9789240018389
DHS-8 Tabulation plan: Table 11.5 and Figure X
API Indicator IDs:
CN_BRFS_C_NOT, CN_BRFS_C_EXB, CN_BRFS_C_WAT, CN_BRFS_C_LIQ, CN_BRFS_C_MLK, CN_BRFS_C_CMP, CN_BRFS_C_DKM
WHO/UNICEF IYCF Indicator 17: Infant feeding area graphs
1) Percentage of youngest children under 6 months who are living with their mother, who are predominantly breastfed.
2) Percentage of youngest children under 2 years who are living with their mother who are age-appropriately breastfed.
Coverage:
Population base: Living children living with their mother born 0-5, or 0-23 months before the survey (KR file)
Time period: Previous day or night before the survey
Numerators:
1) Number of youngest children age 0-5 months living with their mother who were breastfed (m4 = 95) and either exclusively breastfed or given plain water and/or non-milk liquids (see Numerators 2, 3 & 4 for Percent distribution of children who were fed breastmilk only)
2) Number of youngest children under 2 years who are living with their mother who were breastfed (m4 = 95) and:
a) If under 6 months (b19 < 6): given nothing else the day or night preceding the interview (see Numerator for Percentage of children exclusively breastfed), or
b) If age 6-23 months (b19 in 6:23): given solid or semi-solid foods in the day or night preceding the interview (v412a = 1 or v412b = 1 or any of v414a – w = 1 or m39a = 1)
Denominator:
See Calculation for Percent distribution of children who were fed breastmilk only for the selection for the denominator and select for the appropriate age group.
a) Number of youngest children age 0-5 months living with their mother (b19 < 6)
b) Number of youngest children born in the 2 years preceding the survey who are living with their mother (b19 < 24)
Variables: KR file.
|
caseid |
Case Identification |
|
b5 |
Child is alive |
|
b9 |
Child lives with whom |
|
b19 |
Current age of child in months |
|
m4 |
Duration of breastfeeding |
|
m39a |
Did eat any solid, semi-solid or soft foods yesterday |
|
v409 |
Gave child plain water |
|
v409a |
Gave child sugar water |
|
v410 |
Gave child juice |
|
v410a |
Gave child tea or coffee |
|
v412a |
Gave child fortified baby food (cerelac, etc) |
|
v412b |
Gave child other porridge/gruel |
|
v412c |
Gave child soup/clear broth |
|
v413 |
Gave child other liquid |
|
v413a |
Gave child yogurt as a drink |
|
v413b |
Gave child soy milk |
|
v413c |
Gave child chocolate flavored drink |
|
v413d |
Gave child sodas/malt/sports/energy drinks |
|
v413e-i |
Gave child CS liquid |
|
v414a |
Gave child any other vegetables |
|
v414b |
Gave child sausages, hot dogs, frankfurters, ham, bacon, salami, canned food |
|
v414c |
Gave child nuts, seeds |
|
v414d |
Gave child any insects |
|
v414e |
Gave child bread, noodles, other made from grains |
|
v414f |
Gave child potatoes, cassava, or other tubers |
|
v414g |
Gave child eggs |
|
v414h |
Gave child meat (beef, pork, lamb, chicken, etc) |
|
v414i |
Gave child pumpkin, carrots, squash (yellow or orange inside) |
|
v414j |
Gave child any dark green leafy vegetables |
|
v414k |
Gave child mangoes, papayas, other vitamin A fruits |
|
v414l |
Gave child any other fruits |
|
v414m |
Gave child liver, heart, other organs |
|
v414n |
Gave child fish or shellfish |
|
v414o |
Gave child food made from beans, peas, lentils, nuts |
|
v414p |
Gave child cheese, yogurt, other milk products |
|
v414q |
Gave child oil, fats, butter, products made of them |
|
v414r |
Gave child chocolates, sweets, candies, pastries, etc |
|
v414s |
Gave child other solid, semi-solid food |
|
v414t |
Gave child CS foods |
|
v414u |
Gave child CS foods |
|
v414v |
Gave child yogurt |
|
v414w |
Gave child common sentinel sweet food |
|
v414wa |
Gave child CS foods |
|
v414wb |
Gave child CS foods |
|
v414wc |
Gave child CS foods |
|
v414wd |
Gave child CS foods |
|
v414we |
Gave child CS foods |
|
v005 |
Woman’s individual sample weight |
See Calculation for Percent distribution of children who were fed breastmilk only for selection of children for the denominator, including Stata and SPSS code.
Numerator divided by denominator, multiplied by 100.
Missing data on breastfeeding is treated as not currently breastfeeding in numerator and included in the denominator. Missing and “don’t know” data on foods and liquids given is treated as not given in numerator and included in denominator.
If the last-born child is deceased or not living with the mother, questions on foods and liquids are asked of the prior child born in the two years preceding the interview. However, in surveys before DHS-8 the question on breastfeeding was not asked of this child. In this situation the child will be treated as not currently breastfeeding in the numerator and included in the denominator.
The indicators for predominant breastfeeding, age-appropriate breastfeeding are no longer included in the DHS-8 tabulation plan.
See Changes over Time for Percent distribution of children who were fed breastmilk only.
WHO and UNICEF 2021. Indicators for assessing infant and young child feeding practices: definitions and measurement methods. https://www.who.int/publications/i/item/9789240018389
API Indicator IDs:
CN_IYCB_C_PBF, CN_IYCB_C_AGA, CN_IYCB_C_MBF
IYCF 2007 Indicator 11 (Optional): Age-appropriate breastfeeding
IYCF 2007 Indicator 12 (Optional): Predominant breastfeeding under 6 months
Percentage of children age 12-23 months who were:
1) Currently breastfeeding (continuing breastfeeding)
2) Continuing breastfeeding at 1 year (12-15 months) (legacy indicator)
3) Continuing breastfeeding at 2 years (20-23 months) (legacy indicator )
Coverage:
Population base: Children born 12 to 23 months before the survey (KR file)
Time period: Current status at time of survey
Numerators:
Number of children age 12-23 months who are:
1) Currently breastfeeding (m4 = 95 & b19 in 12:23)
2) Currently breastfeeding and age 12-15 months (m4 = 95 & b19 in 12:15)
3) Currently breastfeeding and age 20-23 months (m4 = 95 & b19 in 20:23)
Denominator:
a) Number of children age 12-23 months (b5 = 1 & b19 in 12:23)
b) Number of children age 12-15 months (b5 = 1 & b19 in 12:15)
c) Number of children age 20-23 months (b5 = 1 & b19 in 20:23)
Variables: KR file.
|
caseid |
Case Identification |
|
b5 |
Child is alive |
|
b19 |
Current age of child in months (months since birth for dead children) |
|
m4 |
Duration of breastfeeding |
|
v005 |
Woman’s individual sample weight |
Numerator divided by denominator, multiplied by 100.
Missing data on breastfeeding is treated as not currently breastfeeding in numerator and included in the denominator.
Note that the wording of the question asks “Are you still breastfeeding (NAME)?” rather than “Was (NAME) breastfed yesterday during the day or at night?” The question is asked about all living children under age 36 months but reported for age 12-23 months.
In DHS-8, the indicators for continued breastfeeding at 1 year (12-15 month) and continued breastfeeding at 2 years (20-23 months) have been combined to create the continued breastfeeding (12-23 month) indicator.
When comparing the results of DHS-8 surveys to the earlier surveys, it should be noted that DHS-VI and DHS-7 indicators on continued breastfeeding at 1 year and continued breastfeeding at 2 years were reported for last-born children born in the 2 years preceding the survey and living with their mother.
WHO and UNICEF 2021. Indicators for assessing infant and young child feeding practices: definitions and measurement methods. https://www.who.int/publications/i/item/9789240018389
DHS-8 Tabulation plan: Tables 11.4 and 11.10
API Indicator IDs:
CN_BRFS_C_BRF
WHO/UNICEF IYCF Indicator 6: Continued breastfeeding 12-23 months
IYCF 2007 Indicator 3 (Core): Continued breastfeeding at 1 year
IYCF 2007 Indicator 10 (Optional): Continued breastfeeding at 2 years
MICS6 Indicator TC.34: Continued breastfeeding at 1 year
MICS6 Indicator TC.35: Continued breastfeeding at 2 years
Percentage of children age 0-23 months who were fed from a bottle with a nipple during the previous day or night.
Coverage:
Population base: Children born 0 to 23 months before the survey (KR file)
Time period: Previous day or night before the survey
Numerator: Number of children age 0-23 months who were fed from a bottle with a nipple during the previous day or night preceding the interview (m38 = 1 & b19 < 24).
Denominator: Number of children age 0-23 months (b5 = 1 & b19 < 24)
Variables: KR file.
|
b5 |
Child is alive |
|
b19 |
Current age of child in months (months since birth for dead children) |
|
m38 |
Drank from bottle with nipple yesterday/last night |
|
v005 |
Woman’s individual sample weight |
Numerator divided by denominator, multiplied by 100.
Missing and “don’t know” responses on whether drank from a bottle with nipple yesterday during the day or night are excluded from the numerator but included in the denominator.
WHO and UNICEF 2021. Indicators for assessing infant and young child feeding practices: definitions and measurement methods. https://www.who.int/publications/i/item/9789240018389
DHS-8 Tabulation plan: Tables 11.4 and 11.10
API Indicator IDs:
CN_BRFS_C_BNP
WHO/UNICEF IYCF Indicator 16: Bottle feeding 0-23 months
MICS6 Indicator TC.43: Bottle feeding
1) Median duration (in months) of breastfeeding among children born in the past three years for any breastfeeding.
2) Median duration (in months) of breastfeeding among children born in the past three years for exclusive breastfeeding.
3) Median duration (in months) of breastfeeding among children born in the past three years for predominant breastfeeding.
4)
5) Mean duration (in months) of breastfeeding among children born in the past three years for any breastfeeding.
6) Mean duration (in months) of breastfeeding among children born in the past three years for exclusive breastfeeding.
7) Mean duration (in months) of breastfeeding among children born in the past three years for predominant breastfeeding.
Coverage:
Population base: All births in the 0-35 months preceding the interview (KR file)
Time period: Previous day or night before the survey
Numerators:
1) Number of children born at specified times before the survey for which the mother is still breastfeeding the child (m4 = 95)
2) Number of children born at specified times before the survey for which the mother is exclusively breastfeeding the child (m5 = 95 & numerator 2 only for Percent distribution of children exclusively breastfeeding, or breastfeeding and consuming plain water only, non-milk liquids, consuming formula and/or animal milk, and consuming complementary foods
3) Number of children born at specified times before the survey for which the mother is predominantly breastfeeding the child. Predominant breastfeeding is defined as children either exclusively breastfed or breastfeeding and receiving water or other liquids only, excluding non-animal milk and food-based fluids (m4 = 95 & numerators 2, 3, or 4 only for Percent distribution of children exclusively breastfeeding, or breastfeeding and consuming plain water only, non-milk liquids, consuming formula and/or animal milk, and consuming complementary foods)
Denominator: Number of births at specified times in the three years preceding the survey (b19 < 36)
Variables: KR file.
See variable list for Percent distribution of children exclusively breastfeeding, or breastfeeding and consuming plain water only, non-milk liquids, consuming formula and/or animal milk, and consuming complementary foodsError! Reference source not found..
Utilizes similar numerators and denominators calculated for the proportions any breastfeeding, exclusive breastfeeding, and predominant breastfeeding by time since birth in two-month groups, as given in Percent distribution of children exclusively breastfeeding, or breastfeeding and consuming plain water only, non-milk liquids, consuming formula and/or animal milk, and consuming complementary foods. The medians and means are based on all births that occurred within the three years preceding the interview, including last and other births, surviving or not. Tabulations assume that last-born children age 24 months or older who live with the mother and are breastfeeding are neither exclusively nor predominantly breastfed.
Twins living with their mother are assumed to have the same breastfeeding and complimentary feeding status, and the grouping calculated in Percent distribution of children exclusively breastfeeding, or breastfeeding and consuming plain water only, non-milk liquids, consuming formula and/or animal milk, and consuming complementary foods for the youngest child living with their mother is applied to any twin of that child who is also living with their mother; other children born in the past 3 years are assumed to not be exclusively or predominantly breastfeeding.
In rounds prior to DHS-8, next-to-last birth assumed to not be breastfeeding, thus excluded from numerator but included in denominator.
Numerators and denominators are calculated for each two-month group of time since birth. Numerators and denominators are each smoothed by a three-group moving average. For example, the value of the numerators and denominators for births that occurred 4-5 months before the interview is the average of groups 2-3, 4-5, and 6-7 months. Groups < 2 months and 34-35 months are not smoothed. Smoothed proportions are calculated by dividing the smoothed numerator values by the smoothed denominator values of each two-month group.
Median
Beginning with the lowest time-since-birth group, each group is examined to see whether the proportion breastfeeding, exclusively breastfeeding, or predominantly breastfeeding is less than 0.5. Value of median is determined by linear interpolation of percentage of first group below 0.5 and previous group percentage using the following formula:
median 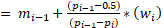
where p i is the proportion breastfeeding, exclusively breastfeeding, or predominantly breastfeeding for the first group where the proportion is below 0.5, p i-1 is the proportion breastfeeding, exclusively breastfeeding, or predominantly breastfeeding for the preceding group, mi-1 is the midpoint value for the preceding group, and w i is the time width of the group taken as the difference between the midpoint value of the current group and the preceding group.
Prior to DHS-7: In The DHS Program rounds prior to DHS-7, for all groups except the first, the midpoint values are one-half month above the lower limit. This midpoint value comes about because the time since birth is calculated as the difference between birth dates and the date of interview, which are accurate for month only (day of month is not ascertained).
For example, if the date of interview were April 2018, the interview could have occurred at any time during the month, from the 1st to the 30th. The same holds true for a birth that occurred in January 2018, at any time between the 1st and the 31st of the month. Thus, the time difference between the date of birth and the date of interview could be between 60 days and 120 days. Assuming a constant distribution by day of month for interviews and for births, the midpoint is 90 days or three months, which is the value of the difference in the century- month codes of the dates. The midpoint value for the group of the difference of two months and three months together is therefore 2.5.
The first group is special. The value of the previous group is assumed to be equal to the percentage of children born 0-35 months before the survey who were ever breastfed. Moreover, births that occur in the month of interview can only come before the date of interview, rather than on any day of the month of interview. Based on simulations, 0.75 is chosen as the midpoint value for the group < 2 months (0-1). The midpoint of the previous group is 0 (day of interview).
DHS-7: The midpoint values are at the midpoints of the range as the difference between the births dates and date of interview are accurate to the day, and month 0 now contains a full month of births.
Using the example above, if the date of interview were April 2018, the interview could have occurred at any time during the month, from the 1st to the 30th. The same holds true for a birth that occurred in January 2018, at any time between the 1st and the 31st of the month. With the day of interview known, and the day of birth known, or imputed, it is possible to calculate the exact age of the child to the day and the age would be between 2.0 months and just less than 4.0 months and would be either 2 month or 3 months when truncated. Similarly, a child born in February 2018 would either be 1 or 2 months old. Combining all date combinations together, a child categorized as 2 months old would on average be 2.5 month, and a child categorized as 3 months old would on average be 3.5 months old. The midpoint value for the group of the difference of 2 months and 3 months together is therefore 3.0.
In DHS-7, the first group is still special, and the value of the previous group is still assumed to be 1 equal to the percentage of children born 0-35 months before the survey who were ever breastfed. However, because births in the month 0 group now come from births in the month of interview and in the preceding month, the midpoint of the month 0 group is 0.5 and the month 1 group is 1.5, so for the group 0-1 months, the midpoint is 1.0.
Example:
|
DHS-7 |
|
Rounds prior to DHS-7 |
||||||
|
Group |
Pi |
Midpoint |
Width |
|
Group |
Pi |
Midpoint |
Width |
|
<2 |
0.88 |
1.0 |
1.0 |
|
<2 |
0.90 |
0.75 |
0.75 |
|
2–3 |
0.67 |
3.0 |
2.0 |
|
2–3 |
0.70 |
2.5 |
1.75 |
|
4–5 |
0.52 |
5.0 |
2.0 |
|
4–5 |
0.55 |
4.5 |
2.00 |
|
6–7 |
0.40 |
7.0 |
2.0 |
|
6–7 |
0.43 |
6.5 |
2.00 |
Note that the proportions in age each group are not the same between the DHS-7 approach and the prior approach as the calculation of months since birth has changed in DHS-7 to provide a more accurate estimate, thus requiring the change in the method of calculating the median.
DHS-7/8: median duration 
Prior to DHS-7: median duration 
Note also that due to a number of factors including the different calculation of the age groups, and the application of the three-month moving average, the actual calculations are unlikely to result in exactly the same estimates (as the example does) from the two approaches, but they should be quite close. In general the DHS-7 approach is a more accurate estimate.
Mean
The mean duration is the accumulation over all groups of the proportions breastfeeding, exclusively breastfeeding, or predominantly breastfeeding (pi) multiplied by the width of the time-since-birth group (wi). For the first group, the proportion breastfeeding is taken as the proportion ever breastfed for children born 0 to 35 months before the survey.
mean duration 
The calculation of the mean is also affected by the change in approach in the calculation of the time-since-birth groups, which will result in slightly different proportions in each group, and a change in the width of the first two groups.
Birth dates were imputed if missing. Dates of interview are not allowed to have missing data. Respondents with missing reports of breastfeeding are considered to be not breastfeeding. Respondents with missing reports for liquids and foods or who “don’t know” whether the child received the liquids or foods are treated as the liquid or food not given.
Medians and means are based on current status of mothers of the births. The distributions of the proportions of births, by month of birth of the child, are analogous to the lx column of the synthetic life table. The basic assumption is that there has been no change in the proportions breastfeeding, exclusively breastfeeding, and predominantly breastfeeding over time so that proportions that are calculated from births with small times since birth are the same as those of births that occurred earlier, when those earlier births had those durations. For the short period of 36 months, this assumption is very likely to be approximately correct. The proportions are assumed to be the proportion ever breastfed at the time of birth and to decrease monotonically with time since birth. The time at which the proportions decline to 0.5 is taken as the median. The mean is taken similarly from the lx column of the life table, which in this case is the series of proportions by time since birth. Because the sum of proportions equals 1, there is no need to divide the sum of the proportions times the width of the interval.
Because of the relatively small number of births in each month before the interview, the months are first grouped and then smoothed to reduce random fluctuations due to sampling variance.
Mean
Truncated Mean: Because of the limitation to births that occurred within the three years preceding the survey, the mean is truncated if there are mothers who are breastfeeding longer than three years after their last birth. It is very unlikely that the proportions exclusively or predominantly breastfeeding are more than negligible after 35 months since birth. Therefore, it is felt that the truncated mean is very close to the full mean for both of these statistics. On the other hand, any breastfeeding can continue for considerably longer than 35 months so that the mean may be biased somewhat downwards. To get an idea of the possible extent of this bias, the proportions of children who are breastfeeding, by age of child in months, should be examined.
The measures are basedon all births that occurredwithin the three years preceding the interview, including last and other births, surviving or not.
Decisions on Alternatives
Current status medians and means are used instead of measures based on the recall of durations because of the severe heaping (digit preference) on multiples of 3 and 6 months in the recall data.
In the current calculation of median and mean durations, a woman can contribute more than once if she had more than one birth in the three years preceding the survey. An alternative calculation would be to base the medians and means on women rather than births. In this alternative, each woman is represented only once, which is equivalent to durations based on only the last birth. Estimates of durations based on last births (open interval durations) are thought to overestimate average durations of breastfeeding, since they almost always exceed those based on recall after other births (closed interval durations).
As described above under the median calculation the change in the calculation of time since birth required changes in the calculation of the current status median from the proportions amenorrheic, abstaining or insusceptible. See also Age of Children in Chapter 1 for more information on the change in the calculation of time since birth.
The indicators for median and mean durations of breastfeeding are no longer included in the DHS-8 tabulation plan.
WHO and UNICEF 2021. Indicators for assessing infant and young child feeding practices: definitions and measurement methods. https://www.who.int/publications/i/item/9789240018389
API Indicator IDs:
CN_BFDR_C_MDA, CN_BFDR_C_MDE, CN_BFDR_C_MDP,
CN_BFDR_C_MNA, CN_BFDR_C_MNE, CN_BFDR_C_MNP
IYCF 2007 Indicator 13 (Optional): Duration of breastfeeding
MICS6 Indicator TC.36: Duration of breastfeeding